 Click to view dashboard
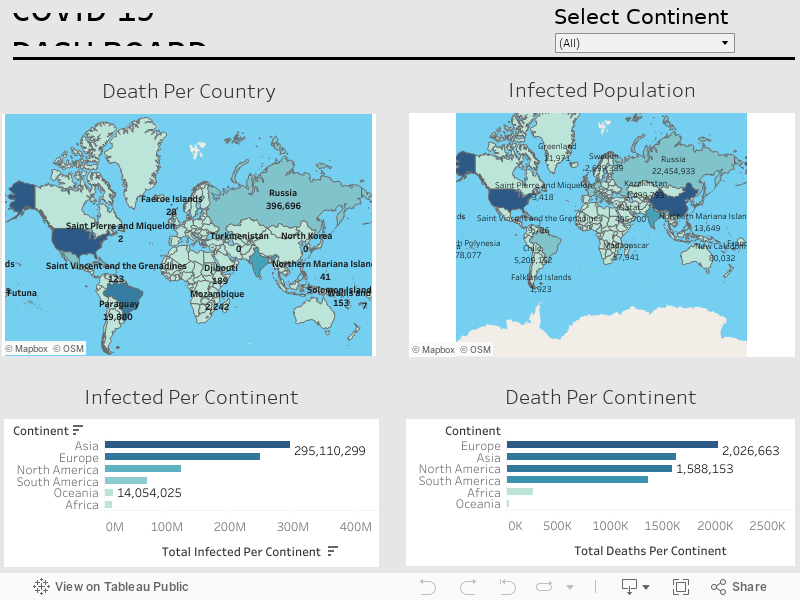
COVID-19 Dataset analysis
About
This project was my first data visualization using Tableau. Its's a semi-interactive dashboard which features a covid-19 data set I downloaded from Our World in Data.
first, I imported the data set to SQL server management studio (SSMS), then I carried out lots of data exploration on the data set to come up with useful insights (Click here to view queries).
After that, I imported the data to excel for data cleaning before importing it to Tableau, where I used the data to create this amazing dashboard!
This is more of a descriptive analysis which features:
•Total death per country
•Total Infected per country
•Total death per continent
•Total death per continent
I sincerely want to thank Alex Freberg for his tutorials on YouTube, they have been of immense help throughout this journey.